Data Interpretation for SBI PO 2018: 27 April
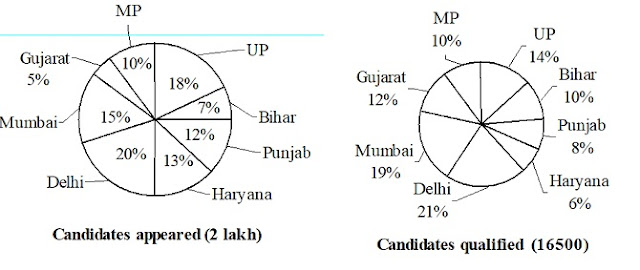
Directions (Q. 1-5): Study the following pie-charts below and answer the questions that follow:
Classification of candidates from different states who appeared and qualified in a competitive exam
1. What is the difference between the number of candidates who qualified from Gujarat, MP and UP together and that of those who qualified from Bihar and Punjab together?
1) 3045 2) 2603
3) 2970 4) 2556
5) None of these
2. What is the percentage of the number of candidates who qualified from UP and Bihar together with repect to those who appeared from Delhi and Haryana?
1) 9.6% 2) 6.8% 3) 6%
4) 8% 5) None of these
3. What is the ratio of the number of candidates who appeared from UP to that of those who qualified from Mumbai, Delhi, Haryana and Punjab together?
1) 3 : 2 2) 57 : 79 3) 5 : 9
4) 125 : 108 5) None of these
4. Which of the following states has the least percentage of number of candidates who qualified with respect to appeared from that state?
1) Haryana 2) Delhi 3) Mumbai
4) Gujarat 5) UP
5. In which of the following states the percentage of the number of qualified candidates with respect to the number of appeared candidates is the maximum?
1) Haryana 2) Gujarat 3) Mumbai
4) Delhi 5) UP
Directions (Q. 6-10): Study the following line graph and the table and answer the questions given below:
Percentage of population below poverty line in different states of India from 2006 to 2011.
6. What is the percentage of the population below poverty line in the year 2008 in State B with respect to that in all the years from 2006 to 2011?
1) 18.66% 2) 20.33% 3) 40.66%
4) 30.66% 5) Can’t be determined
7. If there is an increase of 10% in the population of State A in the year 2008, then how many females are there who are below poverty line in that state in the year 2007, if the population in 2008 was 55 lakh in that state?
1) 4 lakh 2) 5.2 lakh
3) 4.9 lakh 4) 3.05 lakh
5) None of these
8. If in the year 2010 the population of State A, B and C was 60 lakh, 55 lakh and 62 lakh respectively, then what is the total population below poverty line in the year 2010 in all three states?
1) 75.60 lakh 2) 64.9 lakh
3) 74.9 lakh 4) 66.50 lakh
5) None of these
9. If the population of State B and C in the year 2010 was 55 lakh and 62 lakh respectively then what will be the ratio of the females below poverty line in State B to that of the females below poverty line in State C in the year 2010?
1) 85 : 99 2) 82 : 97
3) 109 : 124 4) 97 : 123
5) None of these
10. The population of State C in the year 2007 is 40 lakh. If there is an annual growth of 10% in the population of State C from year 2007 to 2009 then what is the percentage increase or decrease in the number of males below poverty line in the year 2009 with respect to that in the year 2007?
1) 21% increase 2) 15% increase
3) 14% increase 4) 18% decrease
5) None of these
Answers:
- 3
- 3
- 5
- 1
- 2
- 5
- 1
- 2
- 3
- 1


